t 检验
均值差异的统计检验
统计建模篇本章需要的宏包,希望大家提前安装
R
install.packages(c("bayesplot", "palmerpenguins", "rstatix", "broom", "ggstatsplot", "infer", "ggthemes"))实验设计
研究某种药物的疗效,一般采用大样本随机双盲对照试验,比较在特定条件下被试的反应,获取相关数据后,会进行组内比较或者组间比较:
- 组内比较, 同一组人,每个人要完成多次测量(重复测量),比如服药第一天的情况,服药第二天的情况,服药第三天的情况...,每组的人数是恒定的。
- 组间比较,
A组的被试吃1mg,B组被试吃2mg,C组吃3mg...,每组的人数不要求是恒定的。
这个过程可能会使用two sample t-tests。
提问
我们以企鹅体征数据作为案例,假定企鹅就是我们的被试
R
library(tidyverse)
theme_set(bayesplot::theme_default())

penguins <- palmerpenguins::penguins %>%
  drop_na()
提出问题:
- 企鹅有男女两种性别(
female, male),不同性别的bill_length_mm的均值是否相同? - 企鹅种类有三种(
Adelie, Chinstrap, Gentoo),比较在每个种类下男企鹅和女企鹅bill_length_mm的均值? - 两两比较不同种类的
bill_length_mm的均值?
不同性别的嘴峰长度的均值是否相同
强烈推荐大家先可视化探索
R
penguins %>%
  ggplot(aes(x = sex, y = bill_length_mm)) +
  geom_boxplot() +
  geom_jitter() +
theme(legend.position = "none")接着简单计算,不同性别bill_length_mm均值以及差值
R
penguins %>%
  group_by(sex) %>%
  summarize(avg_rating = mean(bill_length_mm, na.rm = TRUE)) %>%
  mutate(diff_means = avg_rating - lag(avg_rating))
using t.test()
R
t.test(
  bill_length_mm ~ sex,
  data = penguins,
  var.equal = TRUE    # `var.equal = ` 假定两个样本方差是否相等
)
R
t.test(
  bill_length_mm ~ sex,
  data = penguins,
  var.equal = TRUE
) %>%
  broom::tidy()
using rstatix::t_test()
rstatix宏包提供了类似dplyr风格的语法
R
library(rstatix)

penguins %>%
  rstatix::t_test(bill_length_mm ~ sex, var.equal = TRUE)
using ggstatsplot::ggbetweenstats()
探索性数据分析,将包含数据可视化和统计建模两个阶段,可视化为建模提供依据,模型反过来又可以提出不同的可视化方法。ggstatsplot将这两个阶段统一在图形中,即绘制带有统计检验信息的图形,提高数据探索的速度和效率。
R
library(ggstatsplot)

penguins %>%
  ggbetweenstats(
    x = sex,
    y = bill_length_mm,
    pairwise.comparisons = TRUE,
    pairwise.display = "all",
    var.equal = TRUE
  )
using infer: 基于模拟的检验
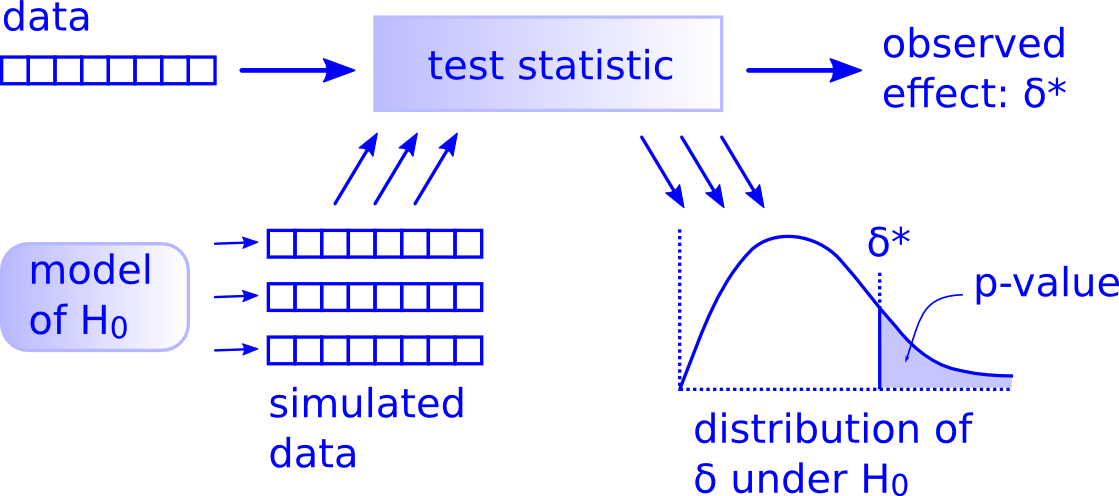
- 实际观察的差别
R
library(infer)
obs_diff <- penguins %>%
  specify(formula = bill_length_mm ~ sex) %>%
  calculate(
    stat = "diff in means",
    order = c("male", "female")
  )
obs_diff- 模拟
R
null_dist <- penguins %>%
  specify(formula = bill_length_mm ~ sex) %>%
  hypothesize(null = "independence") %>%
  generate(reps = 5000, type = "permute") %>%
  calculate(
    stat = "diff in means",
    order = c("male", "female")
  )
head(null_dist)
::: {.rmdnote}
specify()指定解释变量和被解释变量 (y ~ x)hypothesize()指定零假设 (比如,independence=y和x彼此独立)generate()从基于零假设的平行世界中抽样:reps,指定抽样次数type,指定重抽样的类型。calculate()计算每次抽样的统计值 (stat = "diff in means")
:::
- 可视化
R
null_dist %>%
  visualize() +
shade_p_value(obs_stat = obs_diff, direction = "both")- 计算p值
R
pvalue <- null_dist %>%
  get_pvalue(obs_stat = obs_diff, direction = "two_sided")

pvalue
using lm()
R
model <- lm(bill_length_mm ~ sex, data = penguins)
broom::tidy(model)
R
confint(model)可以看到,95%的置信区间与用t.test()的结果完全一样。
每个种类下男企鹅和女企鹅bill_length_mm的均值
企鹅种类有三种,比较在每个种类下男企鹅和女企鹅bill_length_mm的均值?意思是多次t-test
R
penguins %>%
  ggplot(aes(x = species, y = bill_length_mm, color = sex)) +
  geom_boxplot(position = position_dodge(0.8)) +
  geom_jitter(
    position = position_jitterdodge()
  ) +
  scale_x_discrete(
    expand = expansion(mult = c(0.3, 0.3))
  ) +
  theme(legend.position = "none")
using group_modify() + t.test()
R
penguins %>%
  group_by(species) %>%
  group_modify(
    ~ t.test(bill_length_mm ~ sex, data = .x, var.equal = TRUE) %>%
      broom::tidy()
  )
using rstatix::t_test()
R
library(rstatix)

penguins %>%
  group_by(species) %>%
  rstatix::t_test(bill_length_mm ~ sex, var.equal = TRUE)
using ggstatsplot::grouped_ggbetweenstats()
R
library(ggstatsplot)

penguins %>%
  grouped_ggbetweenstats(
    x = sex,
    y = bill_length_mm,
    pairwise.comparisons = TRUE,
    pairwise.display = "all",
    var.equal = TRUE,
    grouping.var = species  # group
)两两比较不同种类的bill_length_mm的均值
企鹅种类有三种,两两比较不同种类的bill_length_mm的均值。
Adelie - ChinstrapAdelie - GentooChinstrap - Gentoo
R
t.test(bill_length_mm ~ species, data = penguins)species 有三组,也就说有三个层级,程序不接受。方法是:成对pairwise t-tests
using pairwise.t.test()
R
pairwise.t.test(x, y) # x is a vector of the data, y is the group factor
R
pairwise.t.test(
  penguins$bill_length_mm, penguins$species,
  alternative = "two.sided",
  paired = FALSE,
  p.adj = "holm"
) %>%
  broom::tidy()
::: {.rmdnote}
注意:pairwise t-tests并不是简单地把每一个可能的配对都做一次t-test
R
penguins %>%
  filter(species %in% c("Gentoo", "Chinstrap")) %>%
  t.test(bill_length_mm ~ species, data = .) %>%
  broom::tidy()
:::
using rstatix::pairwise_t_test()
R
library(rstatix)

penguins %>%
  pairwise_t_test(
    bill_length_mm ~ species,
    p.adjust.method = "holm",
    alternative = "two.sided",
    paired = FALSE
  )
using ggstatsplot::ggbetweenstats()
R
penguins %>%
  ggstatsplot::ggbetweenstats(
    x = species,
    y = bill_length_mm,
    pairwise.comparisons = TRUE,
    pairwise.display = "all",
    p.adjust.method = "holm",
    messages = FALSE,
    var.equal = TRUE,
    alternative = "two.sided",
    ggtheme = ggthemes::theme_economist(),
    package = "wesanderson",
    palette = "Darjeeling1"
  )
参考
- <https://github.com/kassambara/rstatix>
- <https://github.com/IndrajeetPatil/ggstatsplot>
- <http://allendowney.blogspot.com/2016/06/there-is-still-only-one-test.html>
- <https://infer.netlify.app/articles/t_test.html>
R
# remove the objects
# rm(list=ls())
rm(penguins, model, obs_diff, null_dist, pvalue)
R
pacman::p_unload(pacman::p_loaded(), character.only = TRUE)