哺乳动物分析
物种数据探索
应用篇我在网上看到这张图
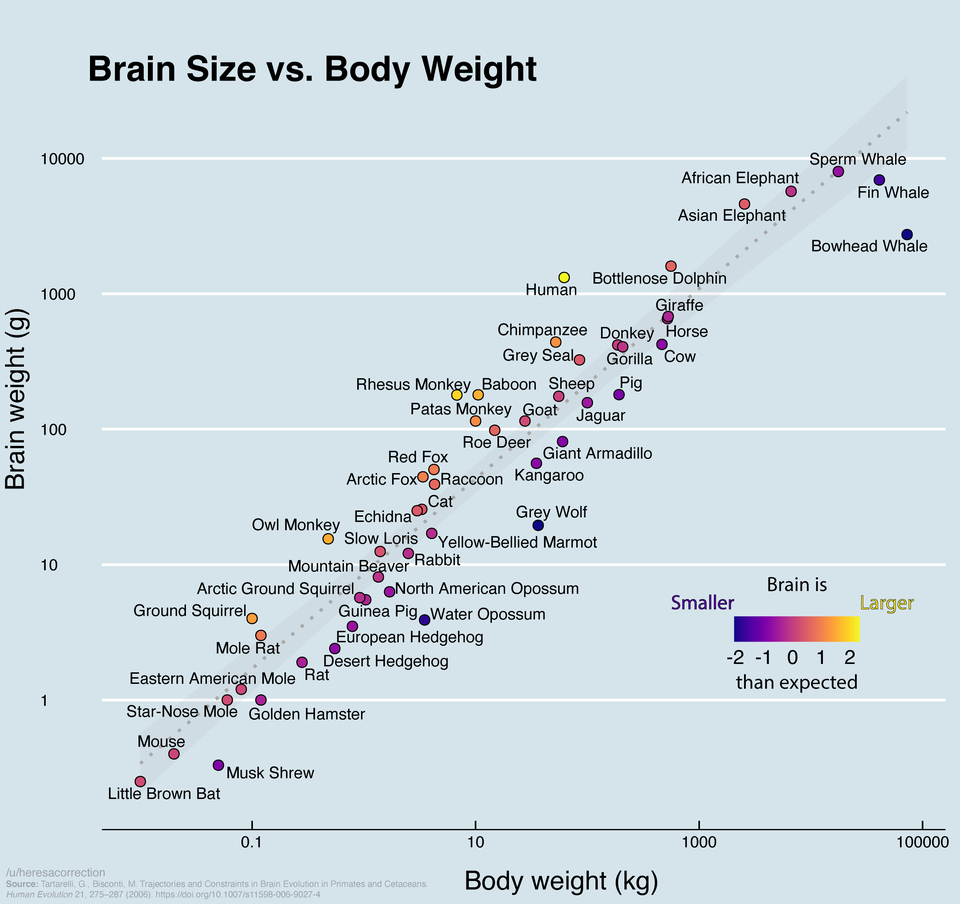
找到数据来源是一篇文章,我下载了数据,希望能重复这张图。
读取数据
R
library(tidyverse)

data <- readr::read_rds("./demo_data/brain_size.rds") %>%
   janitor::clean_names()
data
数据变换
R
tb <- data %>%
filter(body_weight_kg > 0, brain_weight_g > 0) %>%
mutate(
across(where(is.numeric), log10)
)
tb线性模型
R
m <- lm(brain_weight_g ~ body_weight_kg, data = tb)

df <- tb %>% modelr::add_residuals(m)
可视化
R
library(colorspace)

df %>%
  ggplot(aes(x = body_weight_kg, y = brain_weight_g)) +
  geom_smooth(method = "lm", se = TRUE, color = "gray60", fill = "gray70", linetype = "dashed") +
  geom_point(aes(fill = resid), color = "black", size = 4, shape = 21) +
  ggrepel::geom_text_repel(aes(label = species)) +
  #scale_x_log10() +
  #scale_y_log10() +
  ggthemes::theme_economist() +
  theme(
    legend.position = "none"
  ) +
  scale_fill_continuous_diverging(palette = "Green-Orange")
R
pacman::p_unload(pacman::p_loaded(), character.only = TRUE)