懒人技巧
高效编程窍门
应用篇R社区上很多大神,贡献了很多非常优秀的工具,节省了我们的时间,也给我们的生活增添了无限乐趣。我平时逛github的时候时整理一些,现在分享出来供像我一样的懒人用,因此本文档叫“懒人系列”。欢迎大家补充。
列名太乱了
R
library(tidyverse)
library(janitor)
## install.packages("janitor")
## https://github.com/sfirke/janitor
R
fake_raw <- tibble::tribble(
  ~id, ~`count/num`, ~W.t, ~Case, ~`time--d`, ~`%percent`,
  1L, "china", 3L, "w", 5L, 25L,
  2L, "us", 4L, "f", 6L, 34L,
  3L, "india", 5L, "q", 8L, 78L
)
fake_raw
R
fake_raw %>% janitor::clean_names()比count()更懂我的心
R
mtcars %>%
  dplyr::count(cyl, sort = TRUE) %>%
  mutate(percent = 100 * n / sum(n))
R
mtcars %>%
  janitor::tabyl(cyl)
比distinct()更知我心
R
df <- tribble(
  ~id, ~date, ~store_id, ~sales,
  1, "2020-03-01", 1, 100,
  2, "2020-03-01", 2, 100,
  3, "2020-03-01", 3, 150,
  4, "2020-03-02", 1, 110,
  5, "2020-03-02", 3, 101
)

df %>%
  janitor::get_dupes(store_id)

df %>%
  janitor::get_dupes(date)
代码太乱了,谁帮我整理下
R
## install.packages("styler")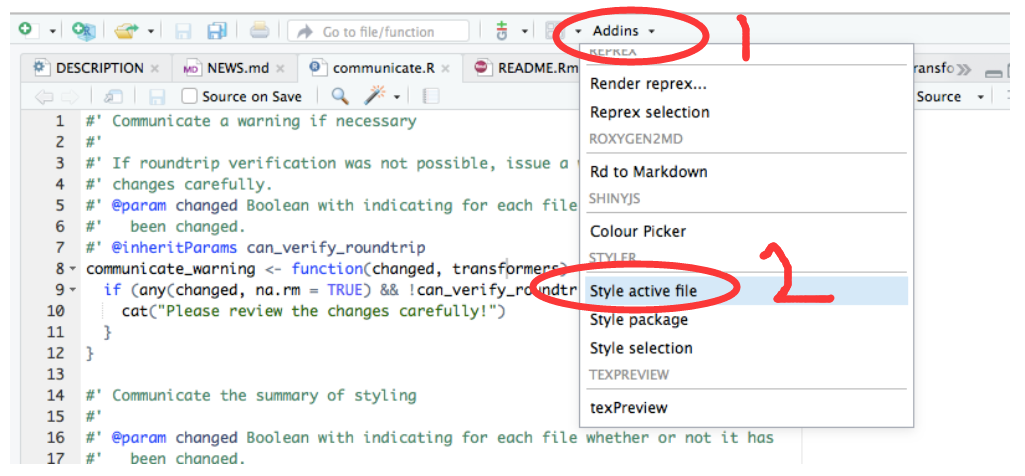
安装后,然后这两个地方点两下,就发现你的代码整齐很多了。或者直接输入
R
styler:::style_active_file()用datapasta粘贴小表格
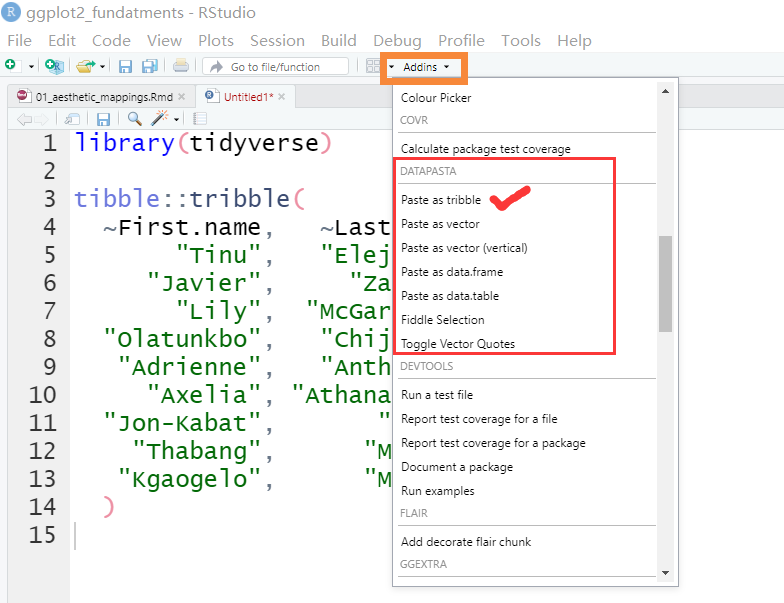
有时候想把excel或者网页上的小表格,放到R里测试下,如果用readr读取excel小数据,可能觉得麻烦,或者大材小用。比如网页<https://en.wikipedia.org/wiki/Table_(information)>有个表格,有偷懒的办法弄到R?

推荐一个方法
- 安装
install.packages("datapasta") - 鼠标选中并复制网页中的表格
- 在 Rstudio 中的
Addins找到datapasta,并点击paste as tribble
谁帮我敲模型的公式
R
library(equatiomatic)
## https://github.com/datalorax/equatiomatic
R
mod1 <- lm(mpg ~ cyl + disp, mtcars)
R
extract_eq(mod1)
R
extract_eq(mod1, use_coefs = TRUE)模型有了,不知道怎么写论文?
R
library(report)
## https://github.com/easystats/report
R
model <- lm(Sepal.Length ~ Species, data = iris)
report(model)
模型评估一步到位
R
library(performance)

model <- lm(mpg ~ wt * cyl + gear, data = mtcars)
performance::check_model(model)
统计表格不用愁
这个确实省力不少
R
library(palmerpenguins)
library(gtsummary)
## https://github.com/ddsjoberg/gtsummary

penguins %>%
  drop_na() %>%
  select(starts_with("bill_")) %>%
  tbl_summary(
    type = list(everything() ~ "continuous"),
    statistic = list(all_continuous() ~ "{mean} ({sd})")
  )
R
gtsummary::trial %>%
  dplyr::select(trt, age, grade, response) %>%
  gtsummary::tbl_summary(
    by = trt,
    missing = "no"
  ) %>%
  gtsummary::add_p() %>%
  gtsummary::add_overall() %>%
  gtsummary::add_n() %>%
  gtsummary::bold_labels()
直接复制到论文即可
R
t1 <-
  glm(response ~ trt + age + grade, trial, family = binomial) %>%
  gtsummary::tbl_regression(exponentiate = TRUE)

t2 <-
  survival::coxph(survival::Surv(ttdeath, death) ~ trt + grade + age, trial) %>%
  gtsummary::tbl_regression(exponentiate = TRUE)


gtsummary::tbl_merge(
  tbls = list(t1, t2),
  tab_spanner = c("**Tumor Response**", "**Time to Death**")
)
统计结果写图上
R
library(ggplot2)
library(statsExpressions)
# https://github.com/IndrajeetPatil/statsExpressions


# dataframe with results
results_data <- corr_test(mtcars, mpg, wt, type = "nonparametric")

# create a scatter plot
ggplot(mtcars, aes(mpg, wt)) +
  geom_point() +
  geom_smooth(method = "lm", formula = y ~ x) +
  labs(
    title = "Spearman's rank correlation coefficient",
    subtitle = parse(text = results_data$expression)
  )
正则表达式太南了
R
library(inferregex)
## remotes::install_github("daranzolin/inferregex")
R
s <- "abcd-9999-ab9"
infer_regex(s)$regex
有了它,妈妈再也不担心我的正则表达式了
颜控怎么配色?
R
library(ggthemr) ## devtools::install_github('cttobin/ggthemr')
ggthemr("dust")
R
mtcars %>%
  mutate(cyl = factor(cyl)) %>%
  ggplot(aes(x = mpg, fill = cyl, colour = cyl)) +
  geom_density(alpha = 0.75) +
  labs(fill = "Cylinders", colour = "Cylinders", x = "MPG", y = "Density") +
  legend_top()
用完别忘了
R
ggthemr_reset()画图颜色好看不
scales也是大神的作品,功能多多
R
## https://github.com/r-lib/scales
library(scales)

show_col(viridis_pal()(10))
不推荐个人配色,因为我们不专业。直接用专业的配色网站 colorbrewer
先看看颜色,再选择
宏包太多
R
library(pacman)
## p_load(lattice, foreign, boot, rpart)唉,这个library()都要偷懒,真服了你们了
犹抱琵琶半遮面
R
## https://github.com/EmilHvitfeldt/gganonymize
library(ggplot2)
library(gganonymize)

ggg <-
  ggplot(mtcars, aes(as.factor(cyl))) +
  geom_bar() +
  labs(
    title = "Test title",
    subtitle = "Test subtitle, this one have a lot lot lot lot lot more text then the rest",
    caption = "Test caption",
    tag = 1
  ) +
  facet_wrap(~vs)

gganonomize(ggg)
你可以看我的图,但就不想告诉你图什么意思,因为我加密了
整理Rmarkdown
R
# remotes::install_github("tjmahr/WrapRmd")
# remotes::install_github("fkeck/quickview")
# remotes::install_github("mwip/beautifyR")
如何有效的提问
直接看官方网站,这里不举例了
R
## install.packages("reprex")
## https://reprex.tidyverse.org/
程序结束后记得提醒我
R
## beepr::beep(sound = "mario")你听到了声音吗?
多张图摆放
R
library(patchwork)
p1 <- ggplot(mtcars) +
  geom_point(aes(mpg, disp))

p2 <- ggplot(mtcars) +
  geom_boxplot(aes(gear, disp, group = gear))

p3 <- ggplot(mtcars) +
  geom_smooth(aes(disp, qsec))
R
# Side by side
p1 + p2 + p3
R
# On top of each other
p1 / p2 / p3
R
# Grid
p1 / (p2 + p3)
R
# plot_layout()

p1 + p2 + p3 +
  plot_layout(
    nrow = 2,
    ncol = 2
  )
R
# layout
layout <- "
AAAA
BCCC
"
p1 + p2 + p3 +
plot_layout(
design = layout
)缺失值处理
R
library(naniar)
## https://github.com/njtierney/naniar

airquality %>%
  group_by(Month) %>%
  naniar::miss_var_summary()
看看数据什么情况
R
library(visdat)

vis_dat(airquality)
让妹纸激发你的热情
R
library(tidyverse)
library(cowplot)

plot <- penguins %>%
  ggplot(aes(x = bill_length_mm, y = bill_depth_mm)) +
  geom_point(aes(colour = species), size = 2) +
  theme_minimal()


ggdraw() +
  draw_image("./images/mm.jpeg") +
  draw_plot(plot)
管道都不想
管道都不想写, 写代码还有美感?
R
## library(nakepipe)各种插件,任君选取
R
## https://github.com/daattali/addinslist
R
# remove the objects
# rm(list=ls())
rm(df, fake_raw, ggg, mod1, model, p1, p2, p3, s)
R
pacman::p_unload(pacman::p_loaded(), character.only = TRUE)